Monitor Spring Boot Application Performance with Elastic APM, Elasticsearch and Kibana
Introduction
We know that applications deployed in a production state require large amount of data for performance and debugging purposes. In this article I will teach you how to monitor performance for a simple Spring Boot application.
But first we need to define what is application performance monitoring and why do we need it. Application performance monitoring, also known as APM, is used to check that application meet performance standards and provide a good quality user experience.
Most APM tools are collecting metrics about the response time for incoming requests, CPU utilisation, bandwidth used, memory consumption, data throughput, database commands, code executions and so on. We need APM to have an idea how application behaves over time and how it responds under different throughput’s. Also very often APM dashboards are used to quickly discover, isolate and solve problems when they appear.
In this tutorial we are going to:
- Develop a REST API and some background tasks using Spring Boot 2
- Deploy application as docker container
- Deploy Elastic APM, Elasticsearch and Kibana as docker containers
- Use Kibana APM dashboard to monitor Spring Boot application
To be able to complete this tutorial, I assume you have installed Maven, Docker and docker-compose. If you don’t have it already, follow the official instructions. This article assumes that the Docker runs natively and the containers are accessible through localhost.
Architecture
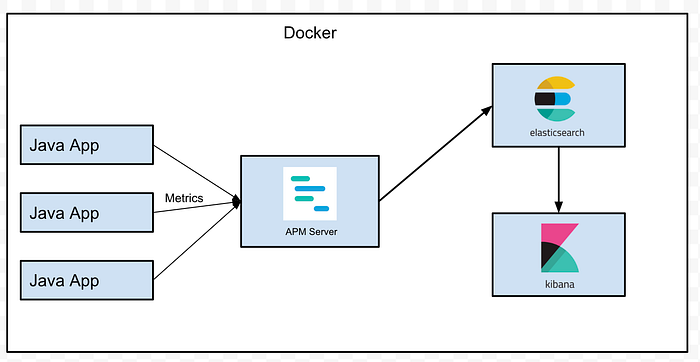
All services used in this tutorial will run as docker containers. Our purpose is to monitor performance for Java applications, so we will have some containers with a Spring Boot application. These applications will be profiled by a java agent provided by Elastic.
The java agent will collect and send metrics to the APM server and then the APM server will transform this metrics and in the end will send them to the Elasticsearch. Once metrics are stored in Elasticsearch, you can explore your application performance by using Kibana built-in APM dashboards which can be found under the “APM” tab.
Elastic APM
Elastic APM allows you to monitor applications in real time, collecting detailed performance metrics on response time for incoming requests, database queries, external HTTP requests, etc. Elastic APM has two components:
- APM Server
- APM agents
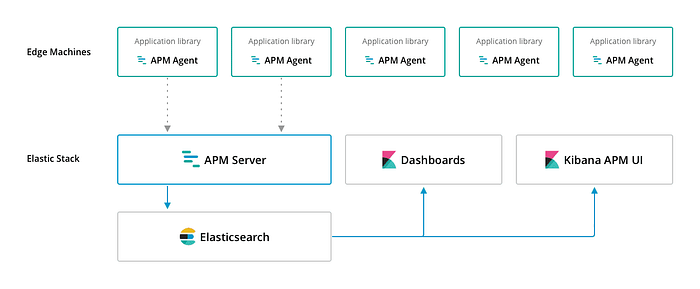
APM server is an open source application written in GO. Its purpose is to receive data from APM agents, transform it into Elasticsearch documents and send them to Elasticsearch. This is performed using an JSON HTTP API.
APM Agents instrument your code and collect performance data and errors at runtime. The data is buffered for a short period of time after which it is sent to the APM Server. Agents are written in the same programming language as your application. Elastic provide agents for the following languages:
- Java
- Node Js
- Ruby
- Python
- Go
The purpose of this article is to monitor Java application, so we will discuss more details about the Java agent. First, it can be used as any other java agent by using -javagent:path/to/agent.jar when you start your jar. Also, you need specify some mandatory parameters such as: apm server url, your service name and java packages to scan, for more details check the official documentation.
The Elastic APM Java agent automatically instruments various APIs, frameworks and application servers, you can check supported technologies here. For our demo application, the agent will automatically collect performance data for Spring Web MVC and Spring Data JPA(MySQL).
If you have technologies that aren’t supported by the agent or you want to collect some custom metrics it can be done using agent API. With this api you can programmatically generate performance metrics.
Spring Boot Application
The Java application which will be monitored is a Spring Boot 2 application. Using Spring Boot we’re going to create a simple REST api for users that are stored in a MYSQL database, the api will provide simple CRUD operations for users data.
Besides the REST api, the application will have some scheduled backgrounds tasks. These tasks do not have any functionalities, they are built only to show how we can monitor background tasks using APM agent pulbic API.
REST endpoints
- GET
/api/v1/users/{userId}- Returns an user with a specific ID or 404 if no user was found - POST
/api/v1/users- Creates a new user. Request body sample:{"name":"Cosmin Seceleanu","email":"[email protected]"} - DELETE
/api/v1/users/{userId}- Deletes an user with a specific userid or returns 404 if user does not exists
Deploy services
git clonehttps://github.com/cosminseceleanu/tutorials.gitcd tutorials/elastic-apm-javamvn package- build Spring Boot jar file- Build and start containers using
docker-compose -f docker/docker-compose.yml up -d - Checking containers status using
docker-compose -f docker/docker-compose.yml psand you should have 5 containers: Elasticsearch, MySQL, Kibana, APM server and the java service

If APM Server service doesn’t start, it’s because it uses Elasticsearch and Elasticsearch take some time to start. To solve this, just restart some containers using this command: docker-compose -f docker/docker-compose.yml restart apm user-microservice .
Spring Boot Service Dockerfile
FROM openjdk:8-jdkEXPOSE 8080
RUN mkdir -p /opt/app
WORKDIR /opt/appARG JAR_PATH
COPY $JAR_PATH /opt/app
RUN wget -O apm-agent.jar https://search.maven.org/remotecontent?filepath=co/elastic/apm/elastic-apm-agent/1.2.0/elastic-apm-agent-1.2.0.jarCMD java -javaagent:/opt/app/apm-agent.jar $JVM_OPTIONS -jar $JAR_NAME
APM Server Dockerfile
FROM docker.elastic.co/apm/apm-server:6.5.4
COPY apm-server.yml /usr/share/apm-server/apm-server.yml
USER root
RUN chown root:apm-server /usr/share/apm-server/apm-server.yml
USER apm-server
APM Server Configuration
In the APM Server configuration we need to configure the input and the output of the server. For the iniput, we need to specify the host and port where the HTTP API will run, and for the output we set Elasticsearch hosts.
Get Cosmin Seceleanu’s stories in your inbox
Join Medium for free to get updates from this writer.
Subscribe
Also, we will configure APM Server to automatically setup APM indices, dashboards and other things in Kibana, for this we just set Kibana uri and enable the following flag setup.dashboards.enabled.
apm-server:
host: "0.0.0.0:8200"
concurrent_requests: 5
rum:
enabled: truequeue.mem.events: 4096
max_procs: 4output.elasticsearch:
hosts: ["http://elasticsearch:9200"]setup.kibana.host: "kibana:5601"
setup.dashboards.enabled: truelogging.level: info
logging.to_files: false
Monitor Application
What will we monitor?
- Time for incoming http requests
- Throughput
- Time for MySQL queries
- Using APM agent public api we will monitor time for some custom code and a background task
To have some metrics we need to call our REST service, we can do this using the curl command. If you want to execute a large number of request you can use this tools:
For the next metrics that I will show you I am going to execute the following curl commands:
- curl -X POST http://localhost:8080/api/v1/users -H “Content-Type: application/json” -d ‘{“name”:”Cosmin Seceleanu”,”email”:”[email protected]”}’
- curl -X POST http://localhost:8080/api/v1/users -H “Content-Type: application/json” -d ‘{“name”:”Foo Bar”,”email”:”[email protected]”}’
- curl -X GET http://localhost:8080/api/v1/users/1
- curl -X GET http://localhost:8080/api/v1/users/2
- curl -X DELETE http://localhost:8080/api/v1/users/2
- curl -X GET http://localhost:8080/api/v1/users/1
- curl -X GET http://localhost:8080/api/v1/users/1
- curl -X GET http://localhost:8080/api/v1/users/2
After you execute some HTTP requests, you can use Kibana by accessing http://localhost:5601 and under the APM tab, you should see a list of services(agents) with some summary performance metrics.
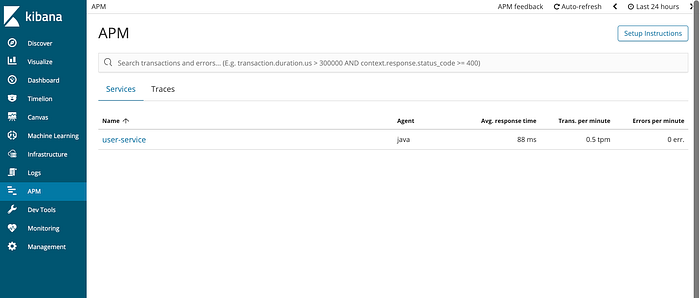
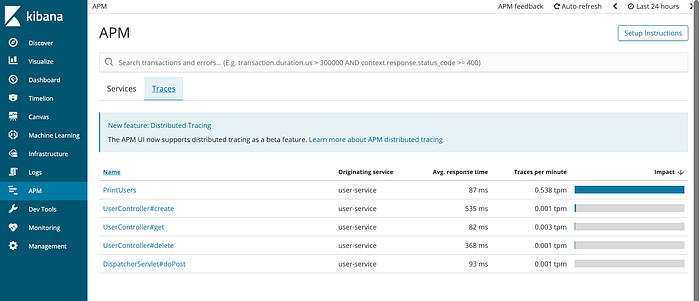
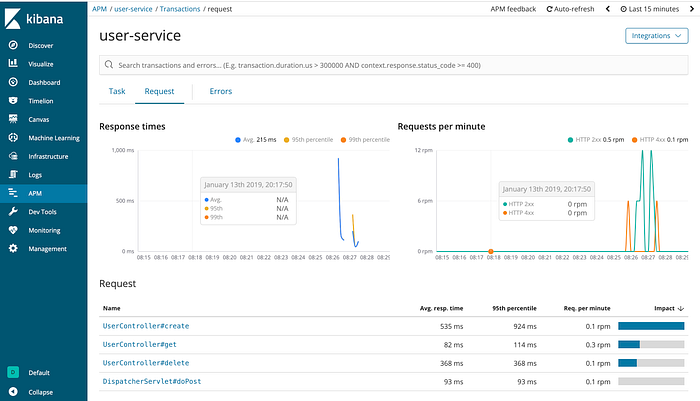
If you want to see more details about a transaction you can click on any transaction, for example if you click on UserController#get transaction you will see details similar with the image below.
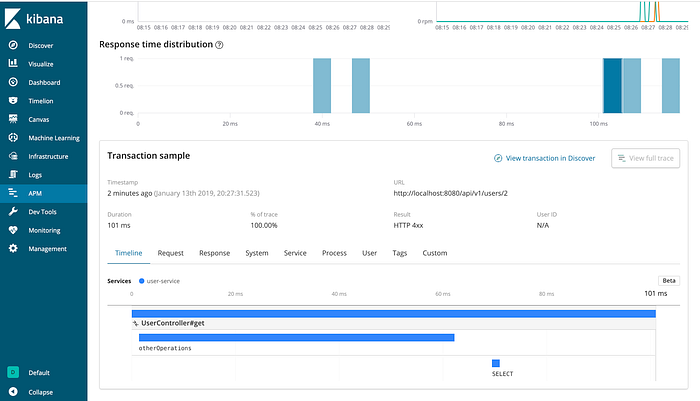
In the above picture we can see that for a GET request, most of the time is spent with otherOperations, this represents a custom method called inside UserService. For this custom metric, I've used agent API to measure this method call's performance, because by default, the APM agent will not measure it. This can be done by adding the annotation @CaptureSpan to the desired method.
package com.cosmin.tutorials.apm.service;import co.elastic.apm.api.CaptureSpan;
import com.cosmin.tutorials.apm.database.User;
import com.cosmin.tutorials.apm.database.UserRepository;
import org.slf4j.Logger;
import org.slf4j.LoggerFactory;
import org.springframework.beans.factory.annotation.Autowired;
import org.springframework.stereotype.Service;import java.util.Optional;
import java.util.Random;@Service
public class UserService {
private final static Logger logger = LoggerFactory.getLogger(UserService.class);
private UserRepository userRepository; @Autowired
public UserService(UserRepository userRepository) {
this.userRepository = userRepository;
}
public User save(User user) {
sleep();
return userRepository.save(user);
} public Optional<User> get(Integer id) {
sleep();
return userRepository.findById(id);
} public void delete(Integer id) {
sleep();
userRepository.deleteById(id);
} @CaptureSpan("otherOperations")
private void sleep() {
try {
Random random = new Random();
int milis = random.nextInt(100 - 20 + 1) + 20;
logger.info(String.format("Sleep ---> %s ms", milis));
Thread.sleep(milis);
} catch (Exception e) {
logger.error(e.getMessage(), e);
}
}
}
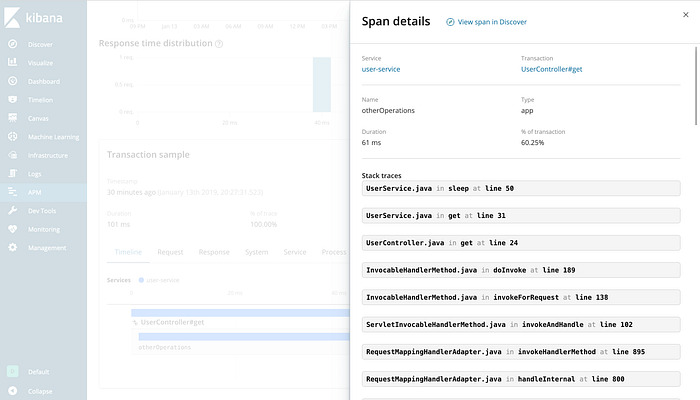
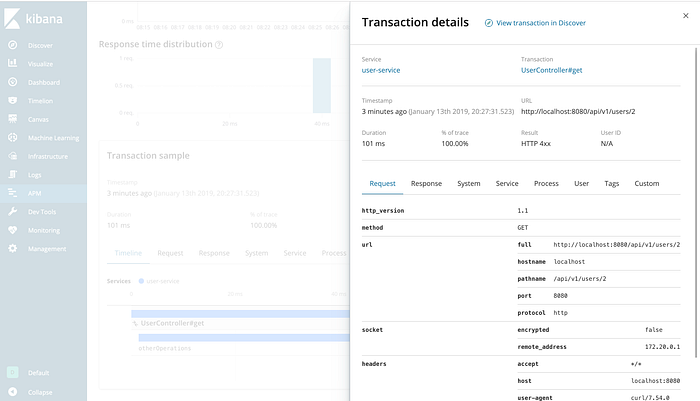
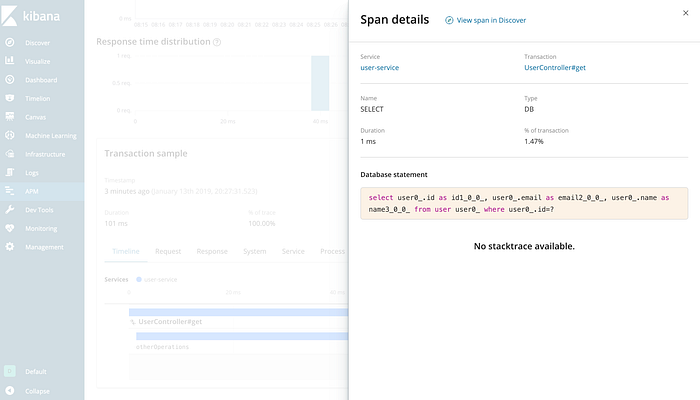
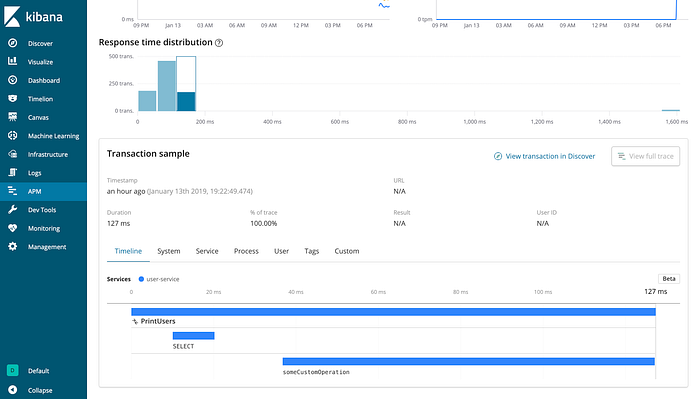
All pictures from above are about incoming HTTP requests, but we also need to monitor background tasks. These tasks are generating metrics that can be found under the Task tab in the top of the dashboard.
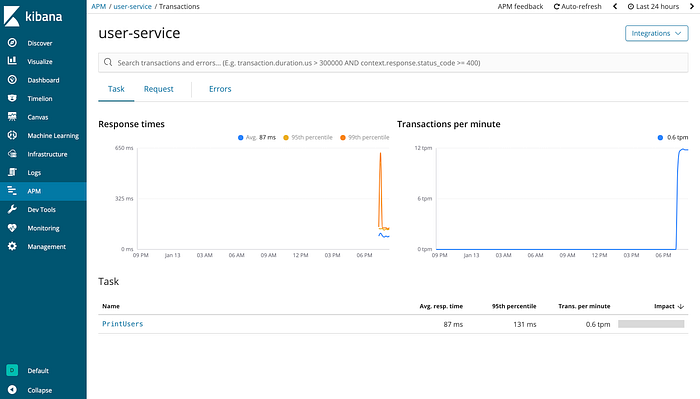
The performance metrics about tasks are generated using agent public Api, but this time we need to generate the transaction by using the annotation @CaptureTransaction as you can see in the bellow Java code:
package com.cosmin.tutorials.apm.tasks;import co.elastic.apm.api.CaptureSpan;
import co.elastic.apm.api.CaptureTransaction;
import com.cosmin.tutorials.apm.database.UserRepository;
import org.slf4j.Logger;
import org.slf4j.LoggerFactory;
import org.springframework.beans.factory.annotation.Autowired;
import org.springframework.scheduling.annotation.Scheduled;
import org.springframework.stereotype.Service;import java.util.Random;@Service
public class PrintUsersTask { private final static Logger logger = LoggerFactory.getLogger(PrintUsersTask.class);
private UserRepository userRepository; @Autowired
public PrintUsersTask(UserRepository userRepository) {
this.userRepository = userRepository;
} @Scheduled(fixedDelayString = "5000")
public void execute() {
logger.info("run scheduled test");
doExecute();
} @CaptureTransaction(type = "Task", value = "PrintUsers")
private void doExecute() {
userRepository.findAll().forEach(user-> logger.debug(user.getEmail()));
sleep();
} @CaptureSpan("someCustomOperation")
private void sleep() {
try {
Random random = new Random();
int milis = random.nextInt(120 - 20 + 1) + 20;
Thread.sleep(milis);
} catch (Exception e) {
logger.error(e.getMessage(), e);
}
}
}
